The Concept: Reactive → Proactive
Transform your approach to data quality from firefighting to prevention
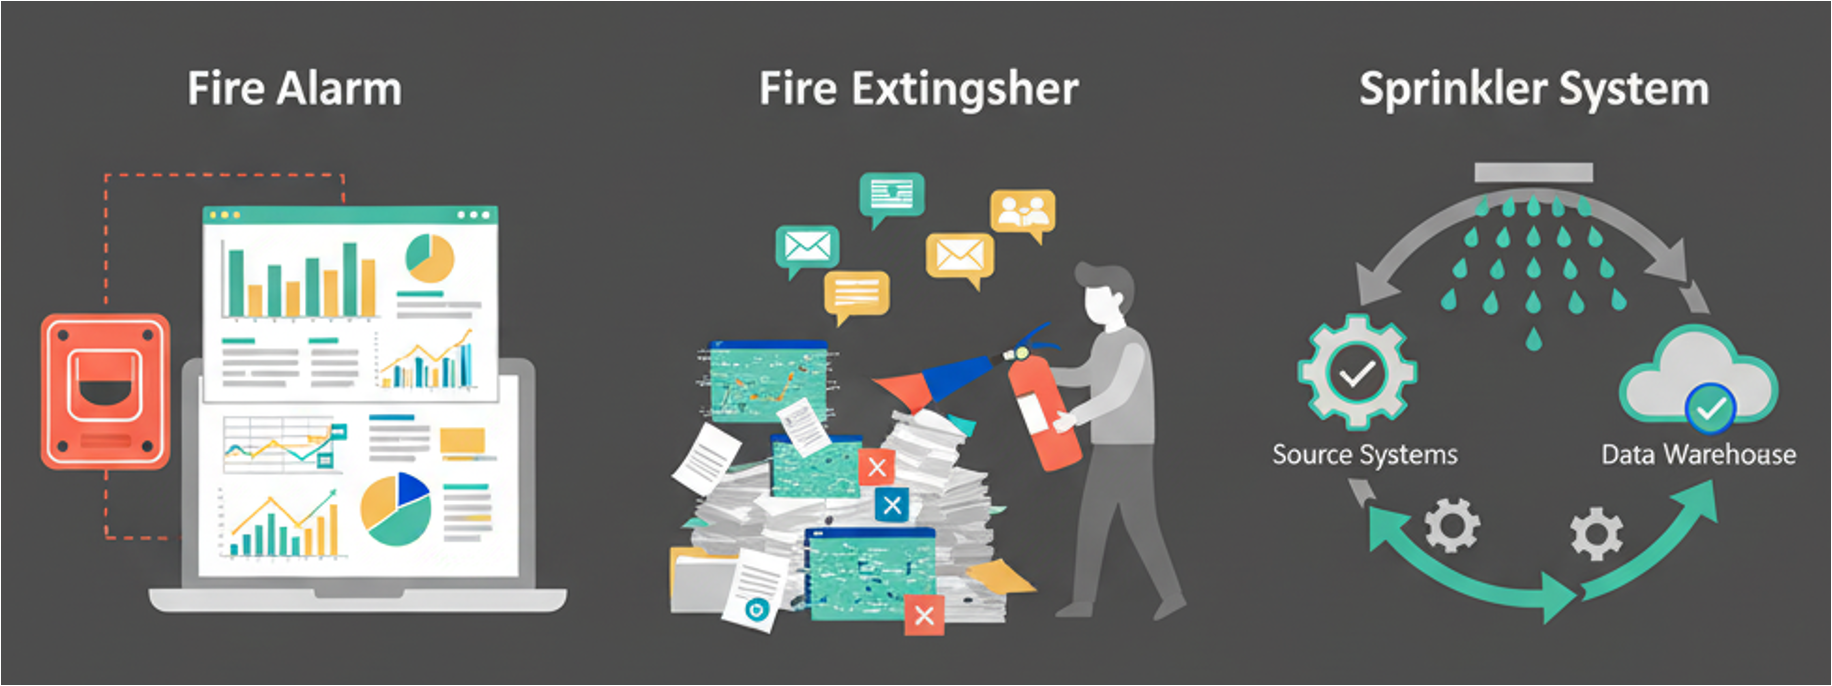
❌ Fire Alarm (Reactive)
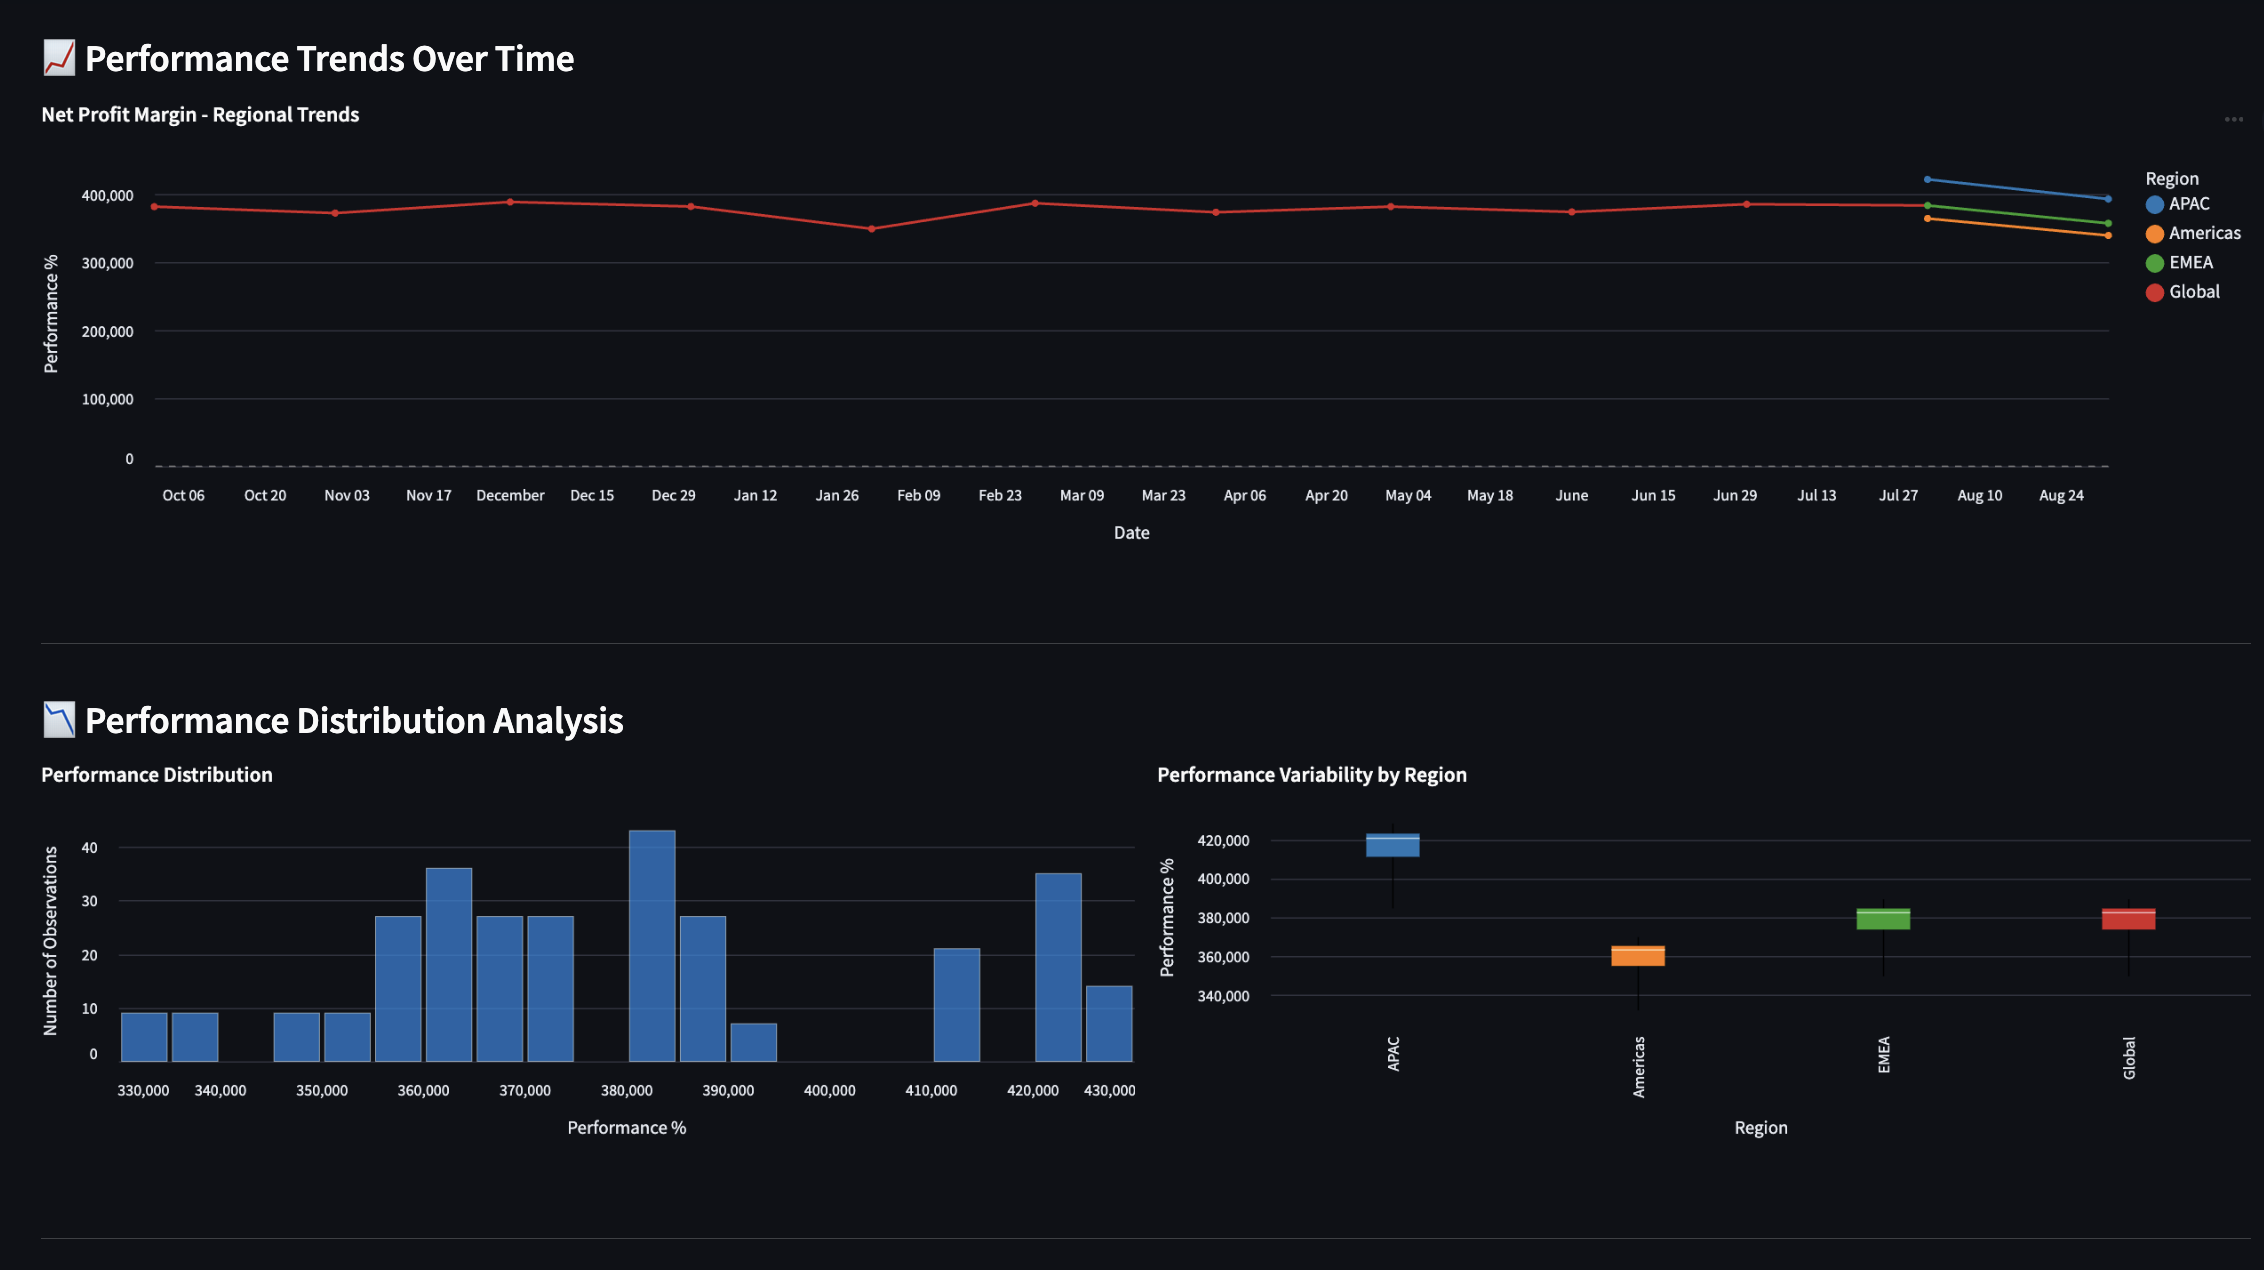
- Dashboards show KPIs are underperforming
- But can't identify the root cause
- Traditional diagnostics take months
- Cost hundreds of thousands in consultant fees
✓ Sprinkler System (Proactive)
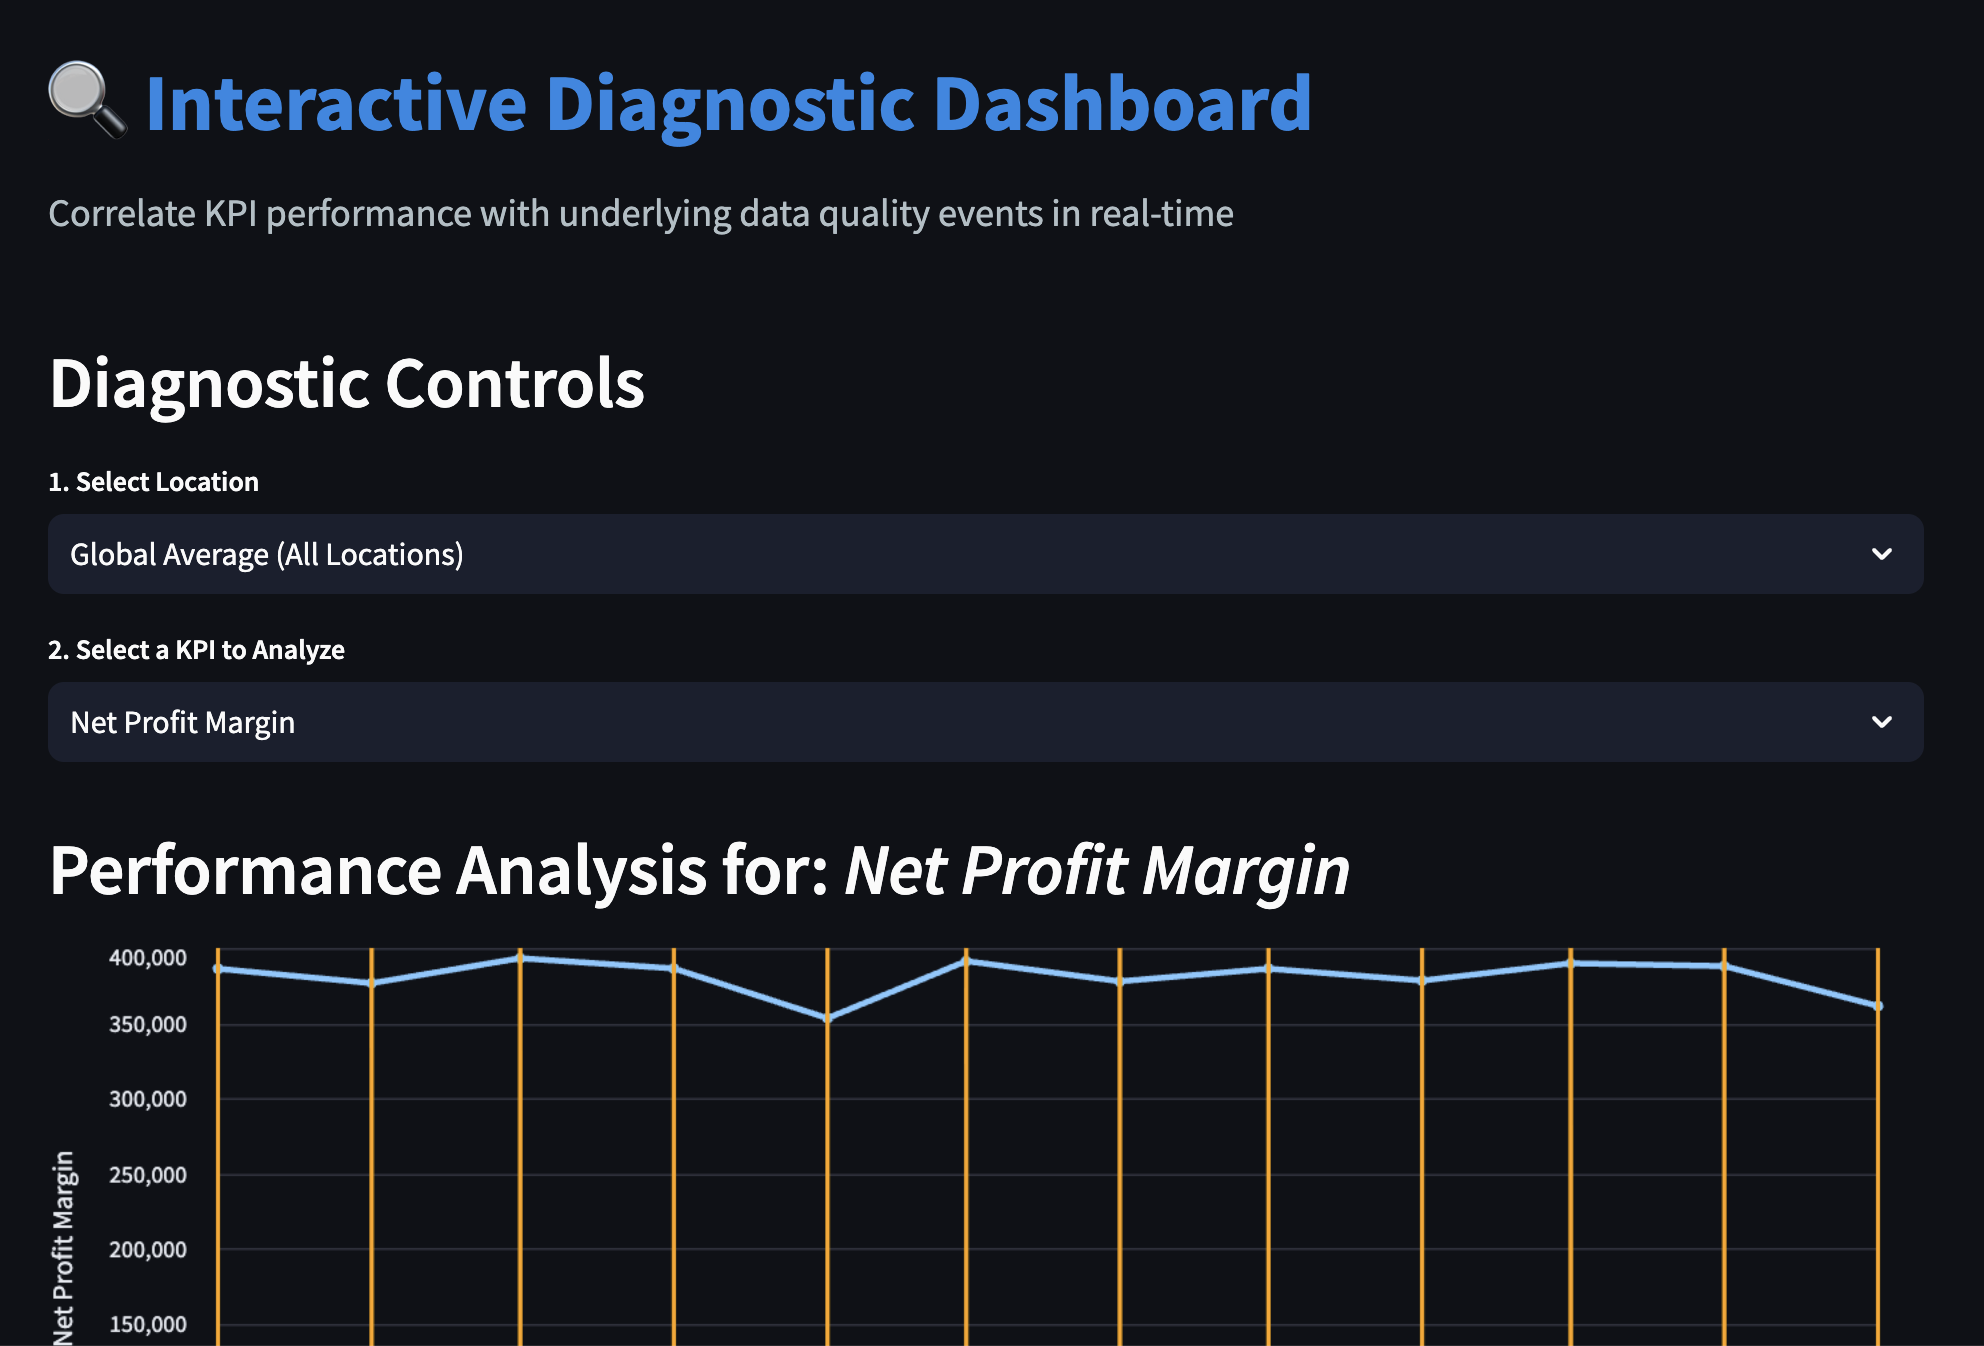
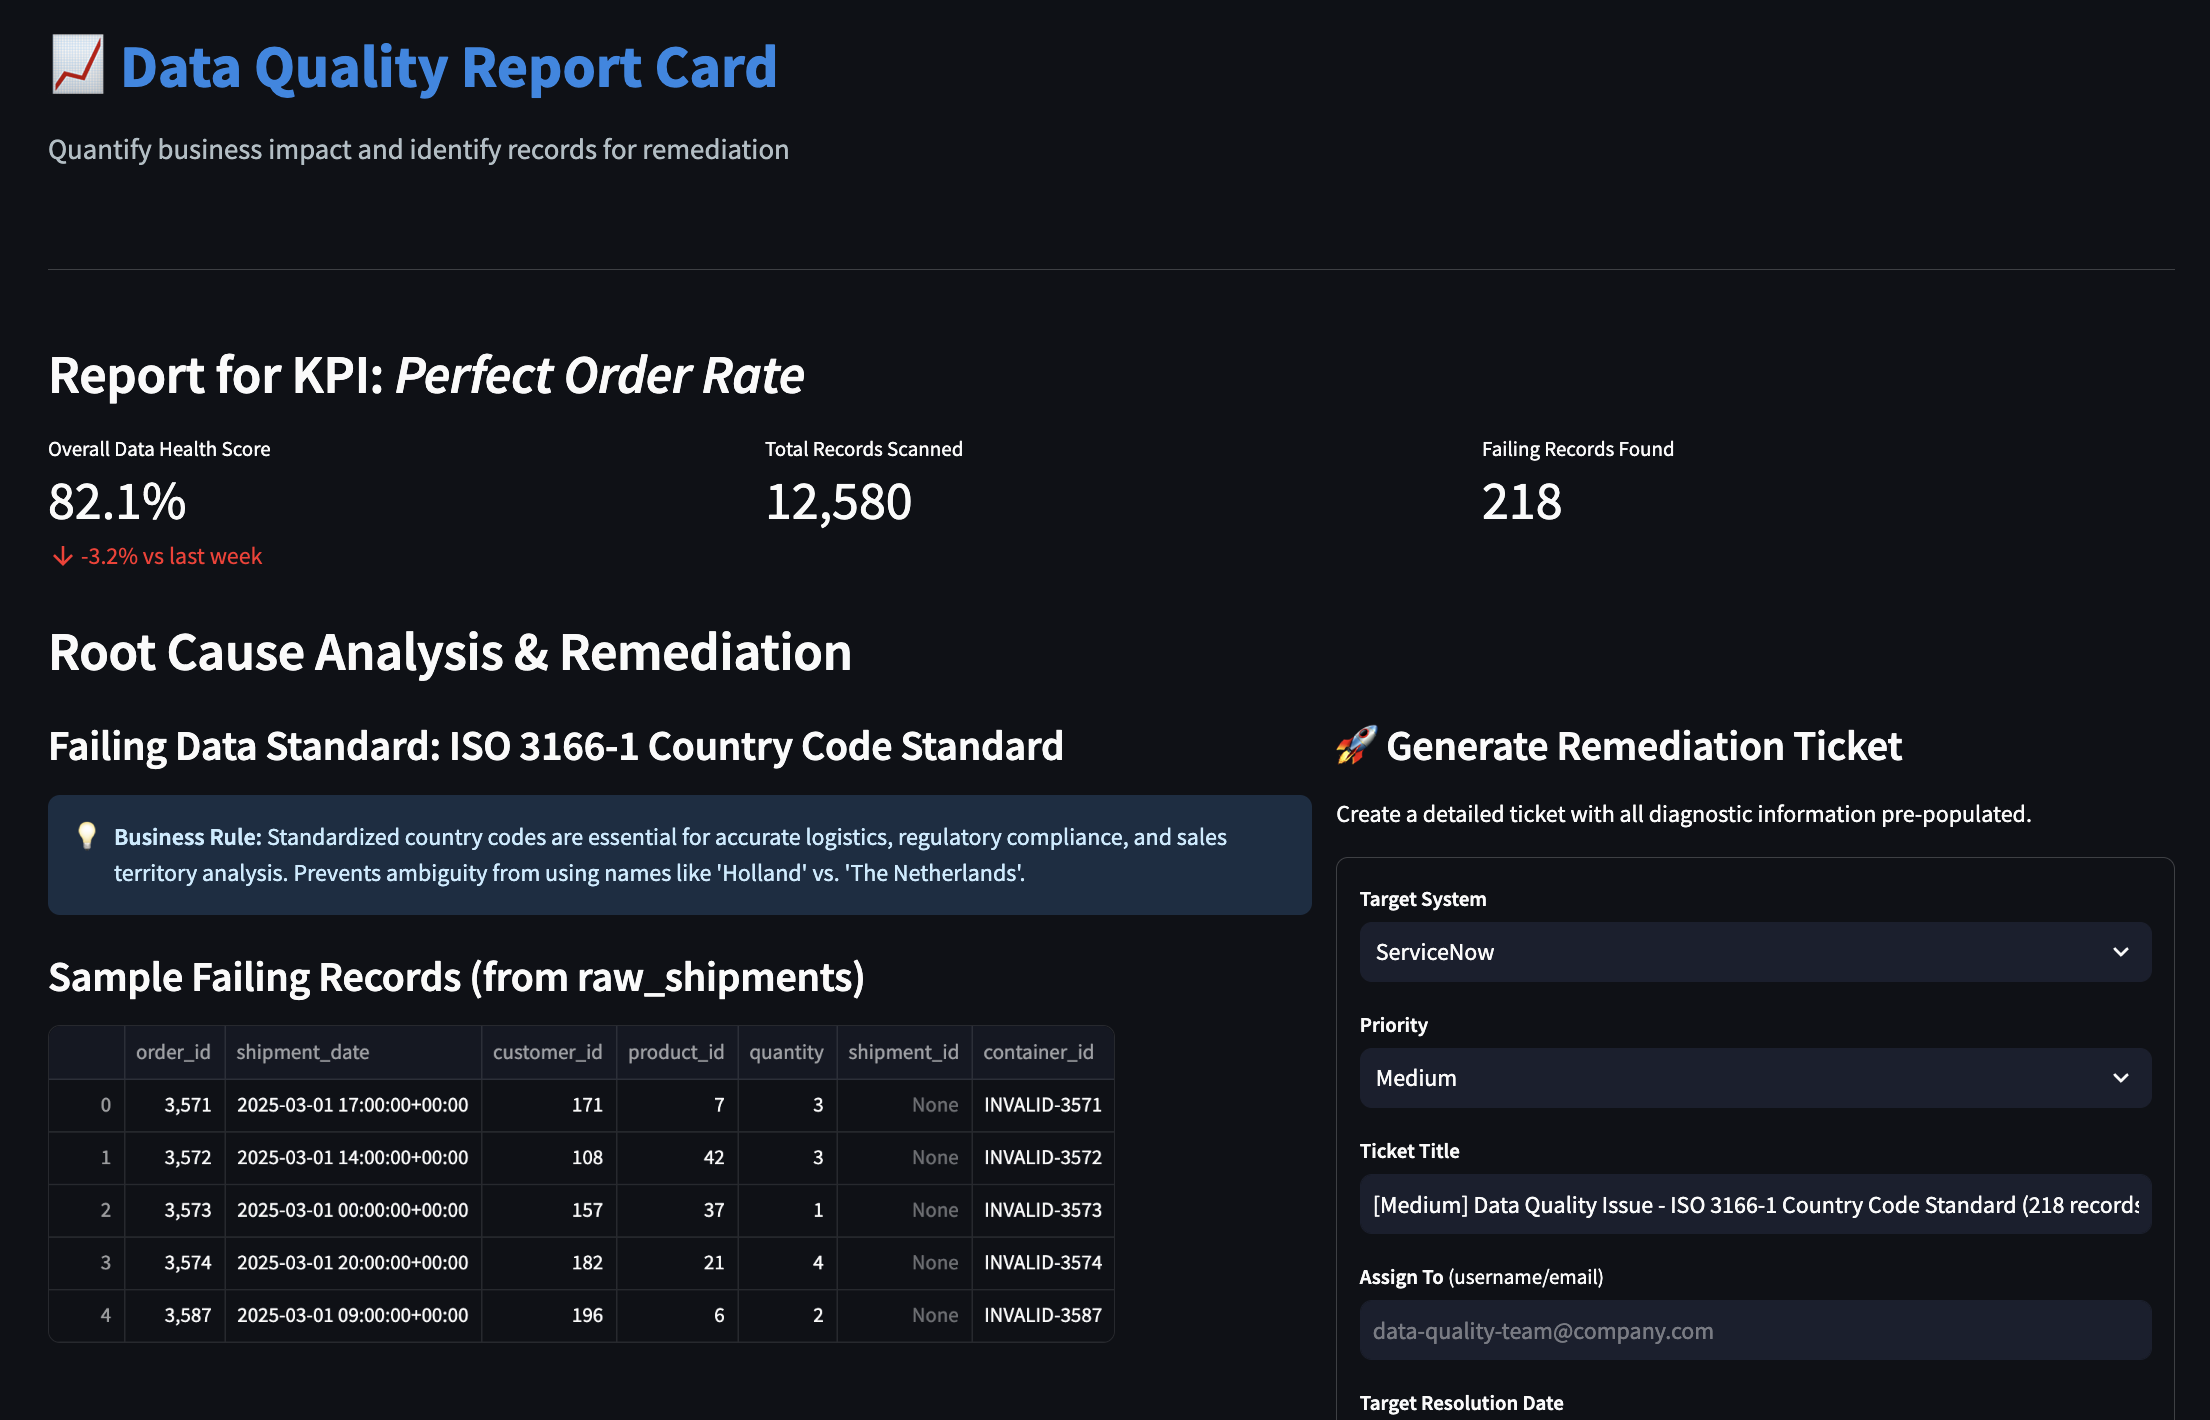
- Instant correlation: KPI to data quality issue
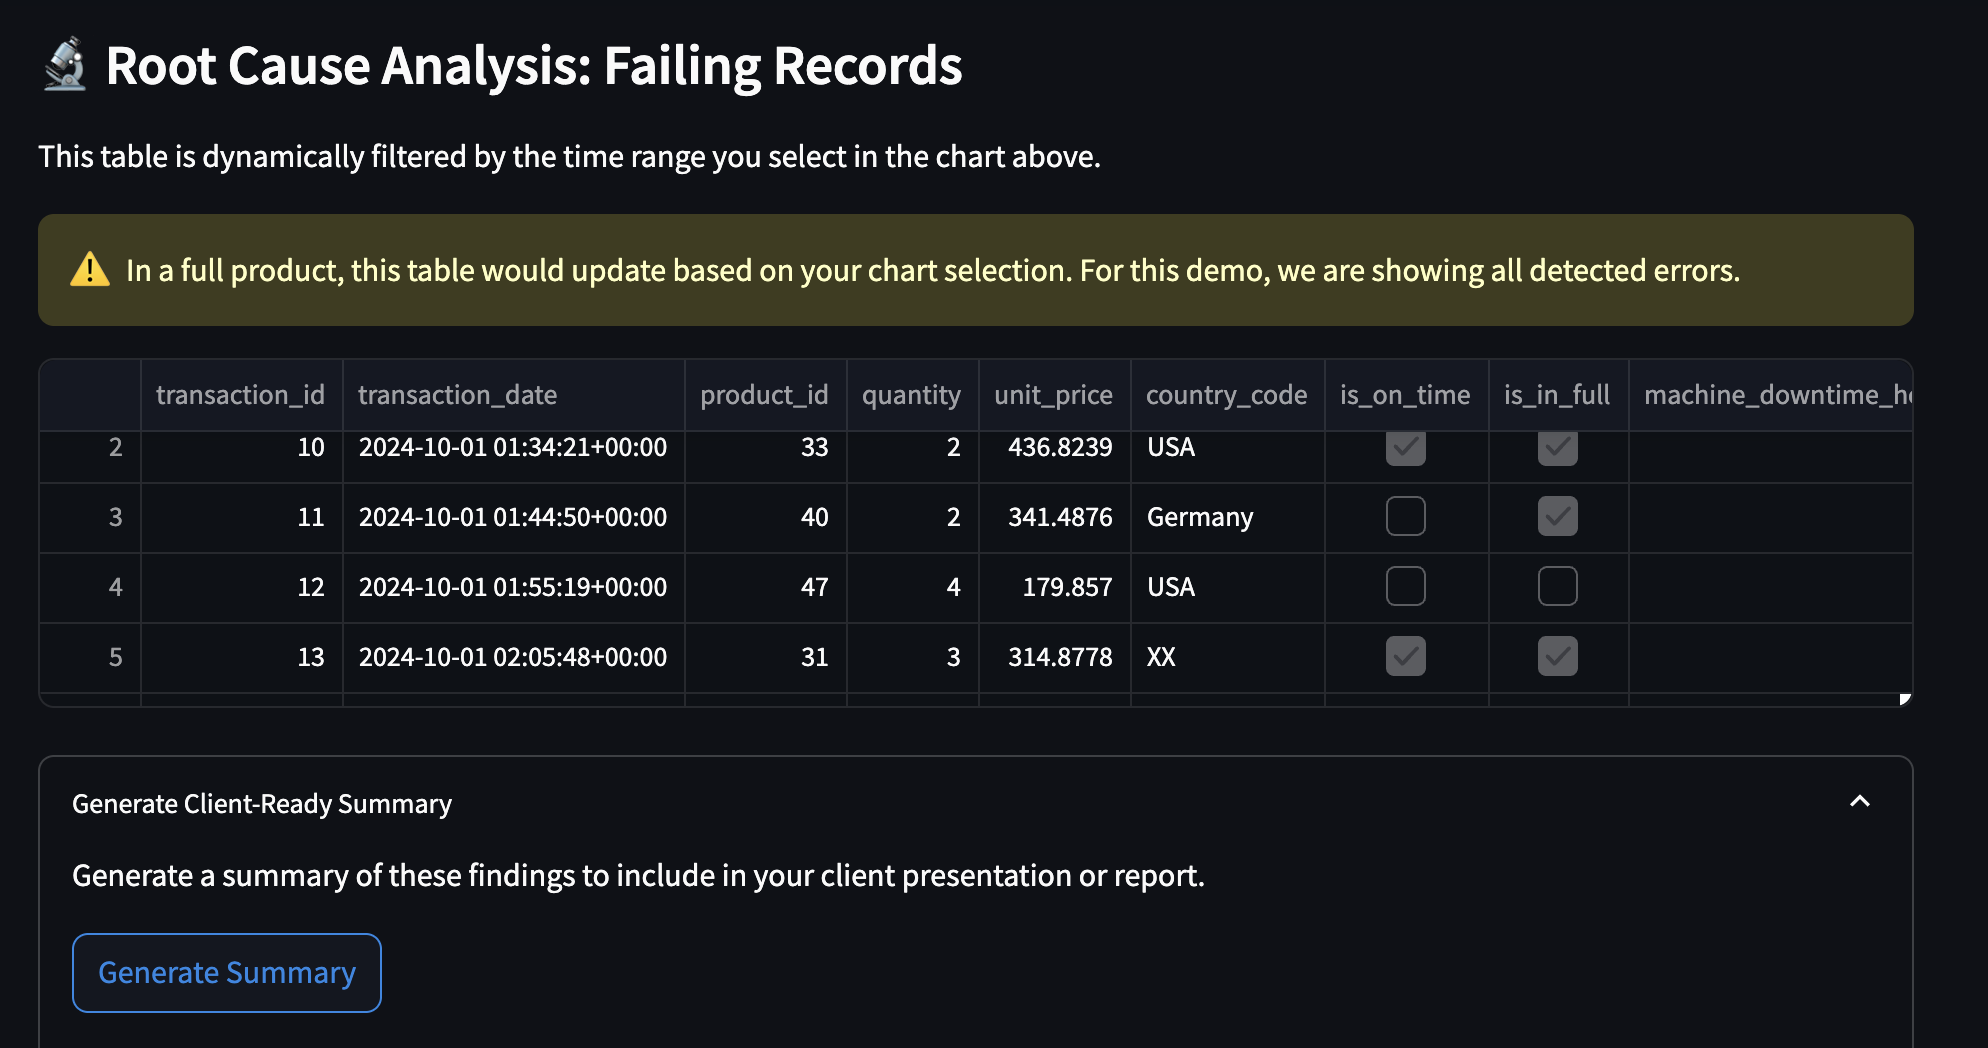
- Root cause traceability: Metric to failing record
- Automated remediation with $$ impact
- 3-minute setup vs. weeks of manual analysis